Designing the pressure, not the shape
The first post in this series was about getting lift out of a computer, and the second was about getting drag out of one. Between them they build an instrument: put a shape in, get numbers back.
What I did not expect is how little that helps. I could compute a section's lift and drag to three figures and still have no idea whether the section was any good — because good turns out not to be a property a section has. It is a relationship between a section and a wing, and until you have pinned down the wing there is nothing to ask.
So this post is about the question rather than the machinery. There is no code in it, and nothing in it comes from my own solver — that one is still failing tests I wrote for it, and is in no position to advise anybody. Everything plotted here is published reference data.
This is also the last of the three posts that are about the field rather than about the thing I am building. If you only ever read one of them, it should probably be this one.
There is no such thing as a good aerofoil#
The first thing to pin down is not the shape. It is where you fly.
A wing in steady flight makes exactly as much lift as the aircraft weighs — no more, or you would be climbing, and no less, or you would be falling. Weight does not change with speed. So the lift coefficient is not something a designer picks: it is dictated, moment to moment, by how fast you are going.
Double your speed and the dynamic pressure quadruples, so the coefficient you need drops to a quarter of what it was. Fly slowly and you need a large one.

That single fact reshapes the problem. You are not designing for a condition, you are designing for a track — a band of lift coefficient, at a band of Reynolds number, traced out as the aircraft speeds up and slows down. A paraglider on my numbers runs from about Cl 0.97 hands-up-slow to 0.27 on full speedbar. It has to be good across all of that, and it has to behave when it leaves it at the top.
The deliverable is a curve#
Given a band rather than a point, the thing being designed is not a number. It is the whole relationship between lift and drag, plotted against itself: the polar.
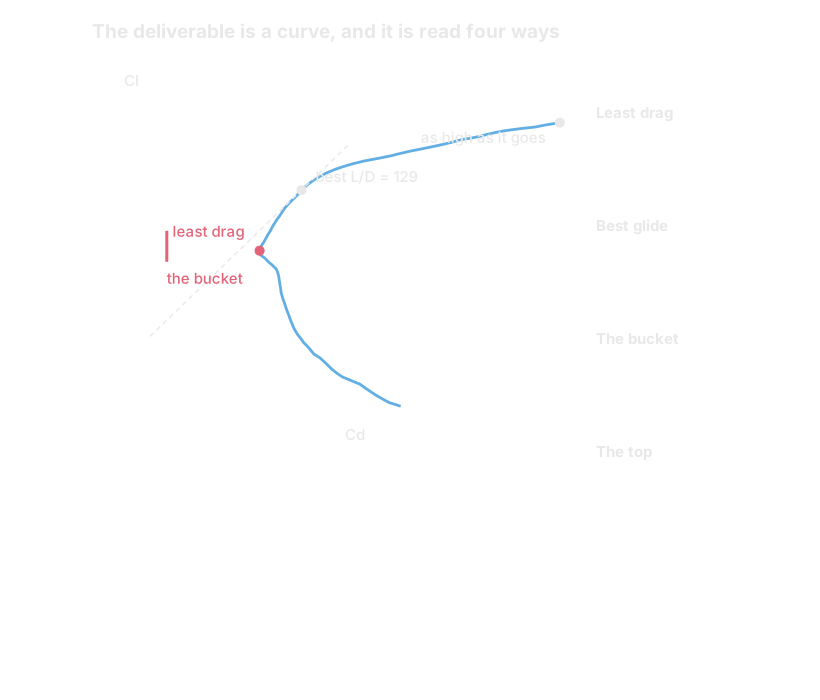
Four things get read off it, and the useful surprise is that they are all different points.
Least drag is the leftmost point of the curve. For this section it is Cd 0.0059, at Cl 0.62.
Best glide is not there. How far you travel per metre of height lost is lift divided by drag, and the largest ratio is where a line drawn from the origin just grazes the curve — which for this section is Cl 1.05, a long way above the least-drag point. Slowing down costs you drag and gains you more lift than it costs. That is why gliders have a speed to fly, and why it is not their minimum-drag speed.
The bucket is the flat-bottomed region where drag barely responds to lift at all. Aiming that region is most of what a designer actually does.
The top is where the curve turns over and the section stops working. Everything past it is stall, and it is the part of the polar that computational tools are worst at — mine has no useful opinion there whatsoever.
The budget#
Here is the piece of physics that everything else in this post is downstream of. It took me a while to see it, and once I did, most of the field stopped looking like a collection of tricks.
Air flowing over the top of a wing speeds up, and where it speeds up the pressure falls. That low pressure is the lift — nearly all of it, as the first post's hero image shows: the suction on top does most of the work.
But the air has to leave. At the trailing edge the flow from the top and the flow from the bottom rejoin and depart together, so they must arrive at very nearly the same pressure — which is close to ambient, because the wing is not doing anything to the air a long way downstream. Whatever the pressure fell by at the front, it must climb back at the back.
And that climb is what a boundary layer cannot do indefinitely. The thin sheared film described in the last post is running on whatever momentum it has left near the wall. Falling pressure pushes it along; rising pressure holds it back. Ask for too much of a climb, and the air nearest the surface stops, reverses, and the flow lifts off.
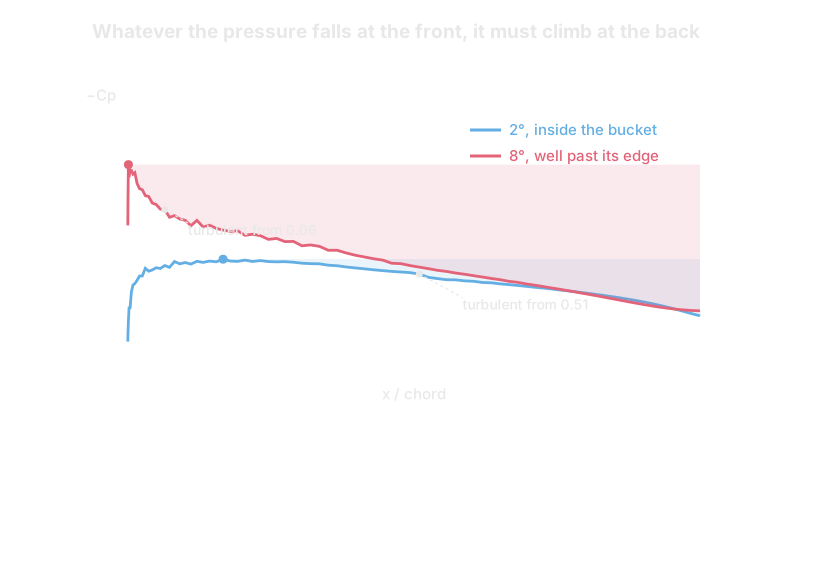
That is the budget, and it is the whole game:
Lift is how deep a hole you dig at the front. Drag and stall are the bill for climbing back out of it.
At 2° this section digs to Cp −0.98 and has to recover 1.2, spread comfortably over the back five-sixths of the chord. At 8° it digs to −3.0, right on the nose, and has to recover 3.1 — nearly three times as much — starting immediately. Nothing about the tail changed. The wing has simply written a cheque the boundary layer has to cash.
Every knob a designer turns is a decision about how to spend that, and there is no way to spend it twice.
Buying a laminar run, and what it costs#
The most valuable thing you can spend it on is keeping the boundary layer laminar.
A laminar layer has roughly a fifth of the skin friction of a turbulent one at a chord Reynolds number of a million, and the gap widens as you go faster. It is also fragile, which is the point: it stays laminar only while the pressure is still falling. Falling pressure damps the little disturbances that would otherwise grow; rising pressure feeds them. Move the point where the pressure stops falling further aft, and transition follows it.
So: hold the pressure falling to 60% of chord instead of 20%, and you have bought forty percent of the wing at a fifth the friction. But the same total climb now has to be done in 40% of the chord instead of 80%, at twice the steepness — and steeper means closer to separating.
That is not a subtlety in aerofoil design. It is aerofoil design. And it shows up in the polar as the thing that gives a bucket its shape.
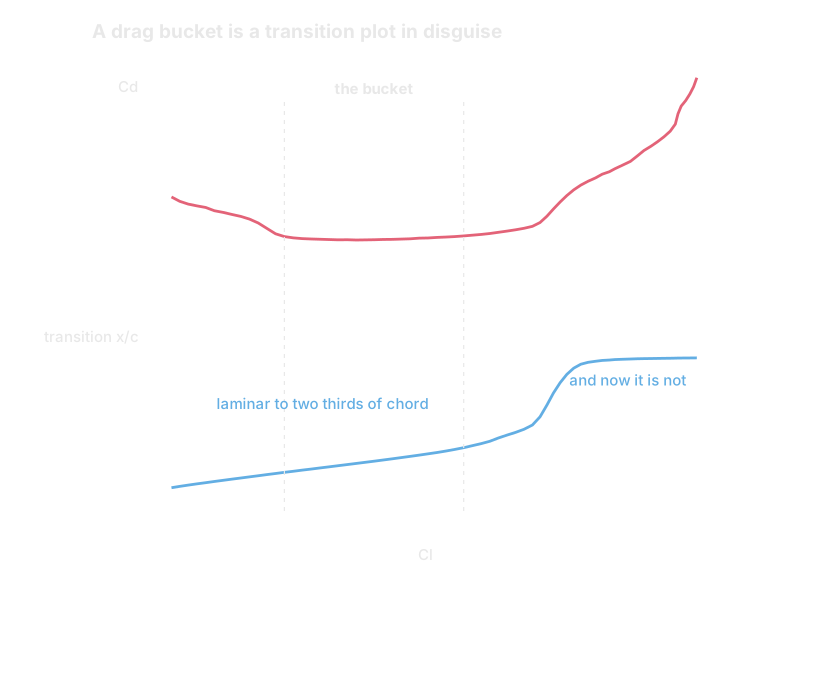
Over the flat part, this section holds laminar flow to roughly two thirds of chord and drag hardly moves. Ask for more lift — dig a deeper hole at the nose — and transition runs forward from 0.59 to 0.05 of chord within half a point of Cl, putting a turbulent layer over the whole wing. The drag more than doubles. The wall of a drag bucket is not a separate phenomenon; it is that collapse, plotted upwards.
Two sections, and neither of them is better#
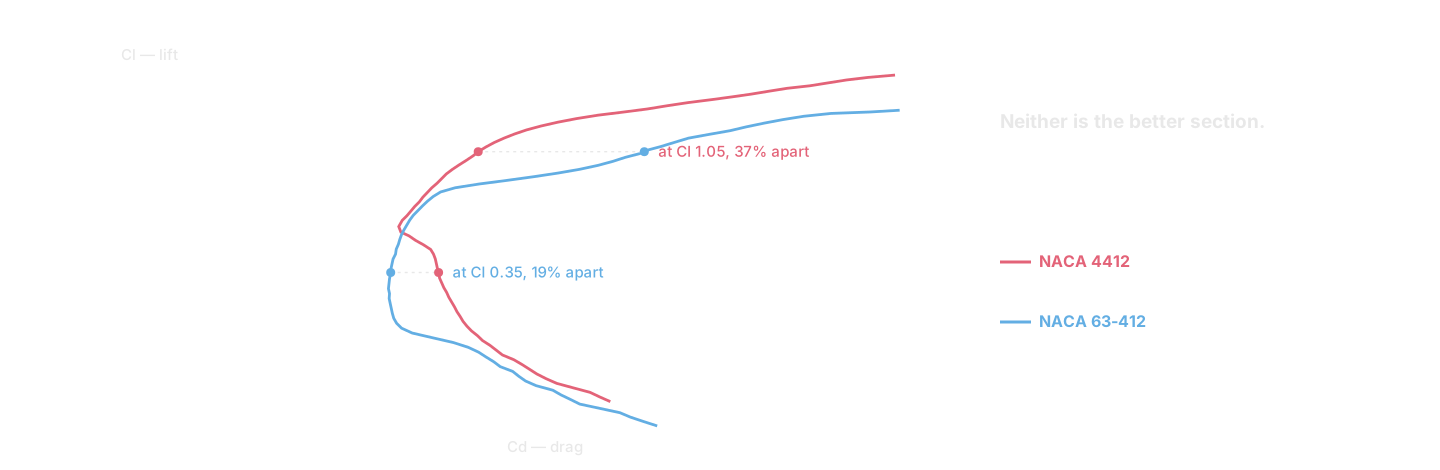
Which brings me to the pair in the hero image. NACA 4412 and NACA 63-412 are both twelve percent thick. Both are cambered. Both are being run at the same Reynolds number, in the same solver, at the same turbulence level.
At Cl 0.35, the laminar-flow section has 19% less drag. At Cl 1.05, the older one has 37% less. They cross at about Cl 0.7.
There is no reading of that data where one of them is the better section. There is only a question about which side of Cl 0.7 your wing spends its life on — and, since the answer is usually "both, at different times", how much you care about each end.
I would add one thing that took me longer to appreciate. The laminar section's advantage is contingent in a way the other's is not. It depends on transition staying aft, which depends on the surface being smooth and the air being quiet. Squashed insects, rain, a repair, a gusty day: all of them move transition forward, and the bucket washes out. The 4412 was never relying on that, so it has less to lose.
Preferring the design whose advantage survives being wrong is not a compromise. On anything you actually fly, it is the design decision.
The knobs#
With the budget in mind, the classic parameters stop being arbitrary and turn into ways of spending it.
Camber — how much the mean line arches, and where the arch is. Camber moves the whole low-drag region up in lift, which is nearly free performance if you fly at high lift coefficients. Real numbers, same family, same Reynolds number:
| section | camber | least drag | at Cl | best L/D | Cm there |
|---|---|---|---|---|---|
| NACA 0012 | 0% | 0.0054 | 0.00 | 76 | −0.007 |
| NACA 2412 | 2% | 0.0055 | 0.35 | 101 | −0.055 |
| NACA 4412 | 4% | 0.0059 | 0.62 | 129 | −0.100 |
The bucket walks up the lift axis almost in step with the camber, and the best lift-to-drag ratio nearly doubles. The price is in the last column: the pitching moment. A cambered section wants to pitch nose-down, and something has to hold it. On a conventional aeroplane it is the tailplane, pushing down, which is lift that must itself be paid for in drag. On a soft wing there is no structure to react a moment at all — the lines and the internal pressure do it, and the wing changes shape while doing it. A Cm of −0.1 is a detail on a Cessna and a design constraint on a paraglider.
Thickness — volume for spars, and on an inflated wing, the ability to hold its own shape. It also blunts the nose, which as we are about to see decides how the thing stalls. Past roughly 15% the drag starts climbing quickly, because the flow has to be accelerated harder over the shoulder and therefore decelerated harder afterwards. Same budget.
Where the thickness peaks — move the maximum aft and the pressure keeps falling further back, which buys laminar run and costs recovery distance. This is the laminar-flow trade in geometric clothing.
The leading-edge radius — small, and the suction peak at high angles becomes a spike; large, and it stays rounded. Almost nothing else about the section matters as much for what happens at the top of the polar.
The trailing edge — a small amount of camber right at the back is worth a startling amount of lift. I found this out by accident, through a bug that built an unintended half-percent bulge at 95% of chord and moved the lift by several percent, because to the outer flow it reads as a small deflected flap. The last post makes the same point from the other direction: the boundary layer builds one of these on every wing, for free, whether you wanted it or not. Aft loading is also where the pitching moment is made or unmade, which is why reflexed sections — turned up at the tail — exist for tailless aircraft.
Stall is a design decision, not an accident#
The top of the polar deserves its own section, because it is the one place where being wrong is dangerous rather than merely inaccurate.
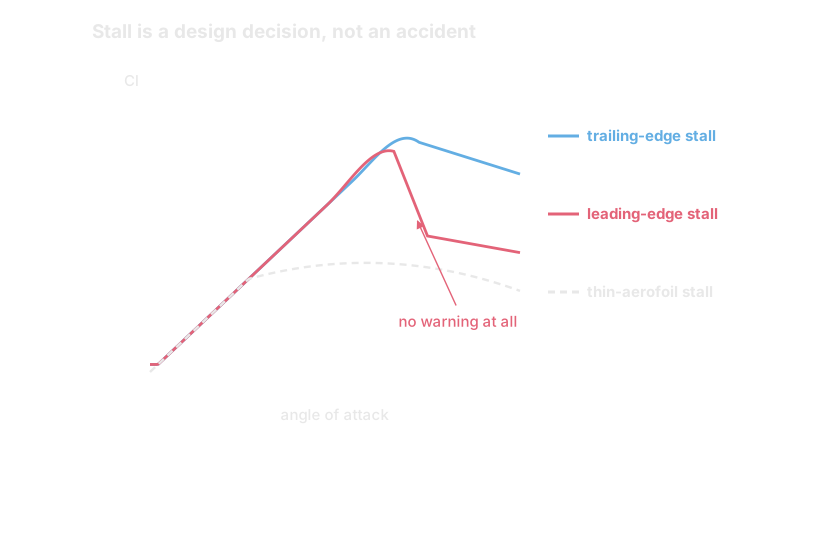
There are three classical ways to run out of wing, and which one you get is largely decided by the nose.
Trailing-edge stall is what thick, blunt-nosed sections do. Separation starts at the tail — where the boundary layer has been climbing longest and has least left — and creeps forward as the angle increases. Lift rolls over gradually, and the separated flow shakes the aircraft on the way, which is a warning.
Leading-edge stall belongs to sharper, thinner sections. The suction peak at the nose gets severe enough that a small separation bubble sitting there bursts, and the entire upper surface lets go at once. The lift curve falls off a cliff, with nothing beforehand.
Thin-aerofoil stall happens on very thin sections and at low Reynolds numbers. A bubble forms near the nose early and simply grows longer as the angle increases, so lift breaks well below what the section might otherwise have reached and then mushes along.
The project instruction I wrote for myself before any of this existed is never optimise for maximum lift alone, and this figure is why: the number at the top of the curve tells you nothing whatsoever about what happens immediately after it. And where there is a real trade — there usually is, because the sharp nose that buys peak lift is the same one that lets go abruptly — a section reaching Cl 1.7 and then dropping without warning is, for anything with a person hanging underneath it, a worse section than one reaching 1.5 and rolling over. For a soft wing it is worse still: the pressure distribution is not only making the lift, it is holding the wing's shape, so losing it abruptly does not merely reduce lift — it can fold the wing.
The same shape is a different design at a different size#
One more thing that has to be part of the brief, because it changes the answer rather than refining it.
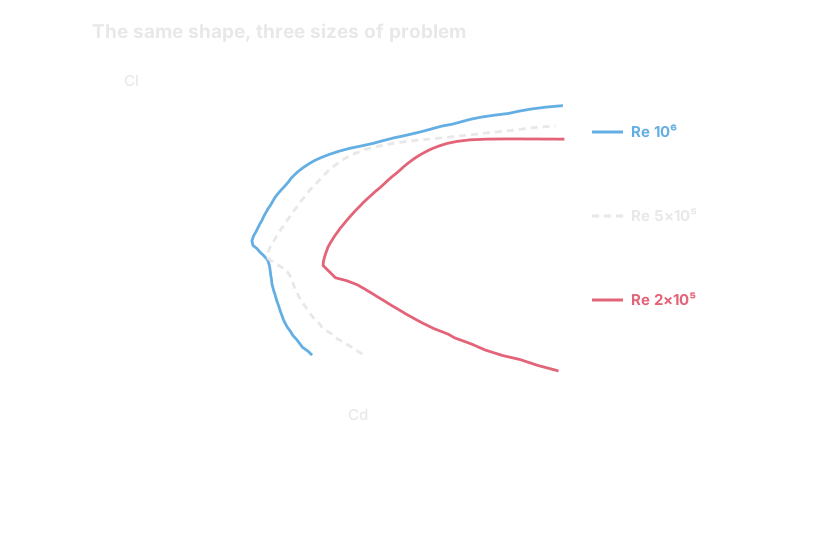
Identical coordinates, three Reynolds numbers, and the best lift-to-drag ratio falls from 129 to 107 to 78. The drag at the bottom of the bucket nearly doubles.
The mechanism is the one the last post ran into: as Reynolds number falls, the laminar boundary layer becomes less and less able to survive a pressure rise, until it starts separating before it has transitioned. It then goes turbulent in mid-air and comes back down, leaving a laminar separation bubble sitting on the surface — which is expensive, and which is the single hardest thing in this whole subject to predict well.
This is why model gliders use sections that would be poor choices full-size, and it is a live problem for real wings too. The tip of a tapered wing runs at maybe a half to a third of the root's Reynolds number, and the tip is where stall behaviour gets decided. A section chosen on root numbers is not a section chosen for the wing.
Nobody designs the shape#
Which brings me to the thing I actually wanted to write down, and the reason for the title.
Read back over everything above. Not one of the trades is naturally expressed in terms of coordinates. They are all statements about the pressure: how deep, how far back before it turns, how steep the climb, how sharp the peak at high angles. The shape is not the design. The shape is the thing that happens to produce the design.
So serious aerofoil work inverts the problem. You specify the pressure distribution you want — a rooftop over the front to hold laminar flow, a recovery shaped to get back to the trailing edge without separating, whatever the brief needs — and you solve for the geometry that produces it. That is inverse design, and it is what Eppler's code, Wortmann's FX sections and Drela's mixed-inverse mode in XFOIL all do.
I do not have an inverse mode. Most people learning this do not. The amateur version of the same discipline still works and is worth adopting immediately: change one thing, and look at the pressure distribution rather than the outline. Your eye cannot read an aerofoil — every section in the useful range looks like every other one — but it can read a Cp plot fluently after about a week. Where is the peak? How steep is the recovery? Did that change put the pressure rise somewhere the boundary layer can pay for?
The section is not the wing#
A closing note on proportion, because it took me embarrassingly long to work out and it changes how much any of this is worth.
A real wing is finite. It sheds vorticity off its tips, which tilts the whole force vector back, and that induced drag is set by span and lift distribution — not by section. At an aspect ratio of 5.5, which is paraglider territory, and Cl 0.6, the induced drag is about 0.0245. The section drag next to it is about 0.007. Add the lines and the pilot, and the section is a small minority of the total.
So the honest framing is this. Choosing between a section with 0.0060 of drag and one with 0.0070 buys you a couple of percent of total drag, and choosing a better planform, or fewer lines, buys you more. That is not an argument for indifference — a couple of percent decides competitions, and section choice also decides the stall, which decides whether the wing is any good to fly. But it is an argument against believing the answer lives here.
And for the wings I care about there is a further discount. A soft wing is not the section you drew. It inflates into shape, deforms under load, has its nose cut open for the intakes, and is pulled into scallops between the ribs. Rigid-section data is the first term of the answer and not the answer, which is exactly why the 2D solver has to be both fast and trustworthy — it is going to be called a great many times inside something larger.
Next#
Which is the point I have been circling for three posts. What I want out of Foilworks is not a number. It is a polar you can believe across a band of lift coefficient and a decade of Reynolds number, that knows where it stops being right and says so.
That is the brief, and the rest of this series is about trying to meet it. From here the posts stop being about aerodynamics and start being about the thing I built: how it is put together and why in Zig, how I tried to prove it was right and what that measurement caught me doing, and finally the rewrite that abandons the loop in the second post and solves the boundary layer and the outer flow as one system with a real wake attached.
They are all, in the end, about the same worry. It is very easy to build something that produces plausible aerofoil numbers, and nothing in the output tells you which kind you have got.
Every measured number here came from published XFOIL polars and the reference boundary layers committed to the project, checked while writing rather than remembered. The two schematic figures say so in their captions. If any of it is wrong, I would like to know.